Balanced Scorecard History & Perspective
The evolution of today's popular Balanced Scorecard framework and body of knowledge dates to the early 1980s in Cambridge and eastern Massachusetts, Norwood in particular. There was a network of people in long gone Index Systems, then Index Group, Harvard, and some Texas Instruments alumni who came to found and build the still thriving Analog Devices company. Analog Devices is one of America's smartest companies.
Balanced Scorecard Precursor
In the late 1980s, some pioneering minds were looking for ways to systematically measure a business. Elsewhere, Cypress Semiconductor was working at the same thing. By the early 1990s, Analog Devices floated its trial baloon at a conference in Berkeley, California that was sponsored by Management Roundtable in Waltham, Massachusetts. At the "Executive Briefing on Design for Manufacturability - Competitive Benchmarking and Performance Measurements Conference," the ADI Corporate Scorecard" was made public for the first time.
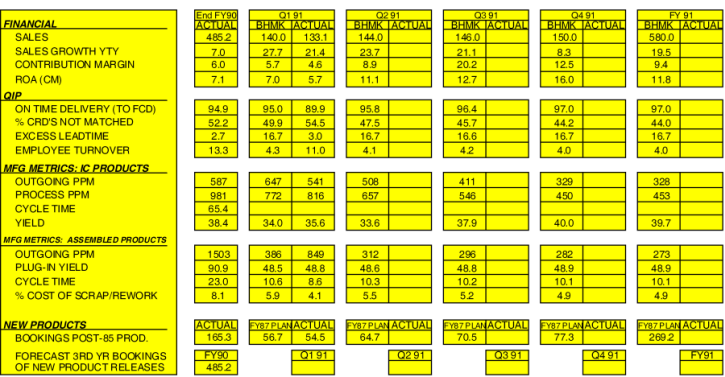
Source: Analog Devices, Inc., "The Executive Briefing on Design for Manufacturability: Competitive Benchmarking and Performance Measurements," Management Roundtable, Inc. May 20- 21, 1991, Berkeley, CA
Balanced Scorecard Evolution
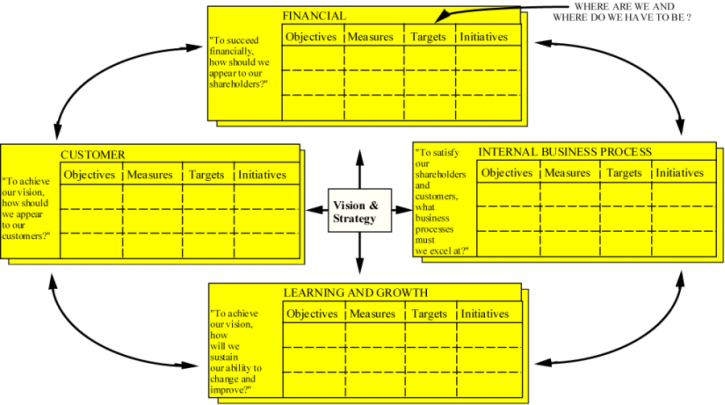
During the next few years, with more industry feedback and networking, Analog refined its internal Corporate Scorecard. Through socialization of the Corporate Scorecard, networking, and informal permissions, Drs. Robert S. Kaplan and David P. Norton and their colleagues finished the systematization of the original Corporate Scorecard. The New Balanced Scorecard was additionally insightful as to what would transpire in the decade ahead. Yes, one must measure "Financial," and "Customers."
"Internal Business Processes" was keeping up with the times. In the early 1980s, the folks at Index Group pioneered the concept of examining businesses through their processes. Michael Hammer spawned from that think tank to form his own business, as did GGI. By the mid 1990s, the processes of a company at the top level had been a focus for fifteen corporate years.
The foresight was in seeing that the flattening of organizations would result in an emphasis on people, the true resources of a company's ability to compete. The "Learning & Growth" module was different, though it was not the most popular quadrant at the time. The same may apply today. But, Charles Savage of the former Digital Equipment Corporation first wrote of this in the 1970s. The focus on Internal Business Processes continued this trend. Reengineering became equivalent with downsizing, unfortunately. Today, we constantly reengineer and it is life as usual. The final wave was Lean Management, that really leveled organizations. What are we left with? People!
In 1996 and thereabouts, via conferences and books, the Balanced Scorecard started along its road to becoming a recognized and respected framework.
Source: Robert S. Kaplan and David P. Norton, "The Balanced Scorecard," Harvard Business School Press, 1996, Page 9.
Balanced Scorecard Strengths
The Balanced Scorecard excels for "transaction-processing" functions. Those functions often represent over 90% of all resources at many companies. It is no wonder that the Balanced Scorecard is widely used, few approaches are able to apply to over 90% of a company.
Project-Based functions, such as Marketing & Product Management, Research & Development, Advanced Development, Product Development, and Engineering are rarely 10% of the workforce. In the early 2000s, out of client necessity AS GGI' s business is in project-based functionsand many of our customers knew that projects represented over 80% of their budget and there was no meaningful provision for them, GGI began working on a method that would pull together five layers of an R&D organization and result in a set of metrics that could be "passed to" or "integrated with" Balanced Scorecards.
Balanced Scorecard & Linked Metrics Portfolio
The Linked Metrics Portfolio® was conceived in 2002. After working with Spider Diagrams, Fishbone Diagrams, Scorecards of several denominations, and listening to R&D professionals lament the miss of 80% of the R&D Spending for project-based functions, it was clear that something better was possible for the innovation, research and development, product creation, engineering, and product development business organizations.
Including client work (not shown) and our Metrics Summits ongoing since 2005, the Linked Metrics Portfolio® is part of practice at numerous companies.
In 2007, the USPTO awarded GGI a Trademark for our Linked Metrics Portfolio®.
If we may interest you further, please visit our Metrics Summit Description page or our Metrics Summit Home Page. One concludes GGI Metrics Summits with a working portfolio of metrics, consisting of typically 28-48 metrics that together measure projects, functions, improvement efforts, and overall aggregate performance and productivity of innovation functions whose primary spending and output is based on projects. Professionals from R&D, Advanced Development, Product Development, and project-based organizations might consider the Linked Metrics Portfolio®.
Finally, our Summits are underpinned by our primary research of industry. Periodic studies have been done across North America since 1998. GGI was founded in 1986.