The Third Coming of Product Design and Benchmark Metrics
The history of product design begins in the 15th century, as the Middle Ages were transitioning to the Renaissance. Italian architects and shipwrights introduced the use of drawings to build ships. Craftsmen throughout Europe began creating “pattern books” enabling artisans in other geographies to replicate desirable products and designs. This basic model stayed in place until the late 19th century, the beginning of the Industrial Revolution.
As mass production began to take hold, product design optimized manufacturability and producibility. Practicality ruled, but it also resulted in bland utilitarian visuals. Competitive forces then took hold as multiple companies that could now produce equivalent products at the same price and quality needed a new differentiating factor.
The First Coming: Individual experts began emerging in the late 1800s. Christopher Dresser (1834-1904) is generally credited with being the first “designer.” He was widely known and many companies sought his talents. The Rhode Island School of Design was founded in 1877 to address the growing demand for best designs. In 1919, Joseph Claude Sinel (1889-1975) proclaimed himself an “industrial designer” and the profession began. But, it was not until The Carnegie Institute of Technology introduced the first “industrial design degree” in 1934 that the profession began to scale.
The Second Coming: The formation of companies whose mission focused on design began in the 1920s, e.g., Alessi (1921) and Teague (1926). The formation of Design Concepts (1967) and Frogg Design (1969) triggered an industry that would form well into the 1990s, e.g., RKS (1980), Continuum (1983), Seymourpowell (1984), KartenDesign (1984), and IDEO (1991). The formation of professional and trade organizations paralleled the growth of degrees in academia and many people now having the profession, e.g., Industrial Designers Society of America (1965) and Design Management Institute (1975). Manufacturers now contracted and partnered with design companies to bring about best designs.
The Third Coming: Critical mass was achieved in the late 1980s. Many people were now expert in industrial and product design. What next then? Specialization of course! This is where we find ourselves today. We now have specialists for materials, for designs in certain industries or in different technologies, for artistic vs. mechanistic, for physical vs. software products, for traditionally produced vs. 3D Printed products, and more. User Interface is a great example. We now distinguish between User Interface and User Experience and Customer Experience. The Venn diagrams overlap, but there is a discipline in each area.
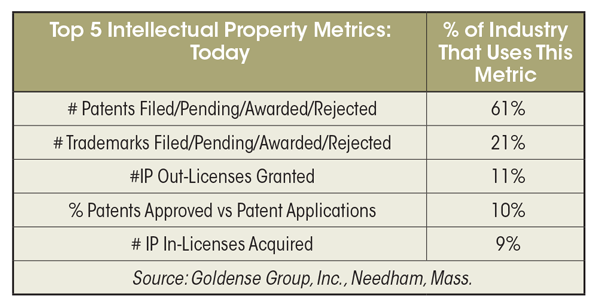
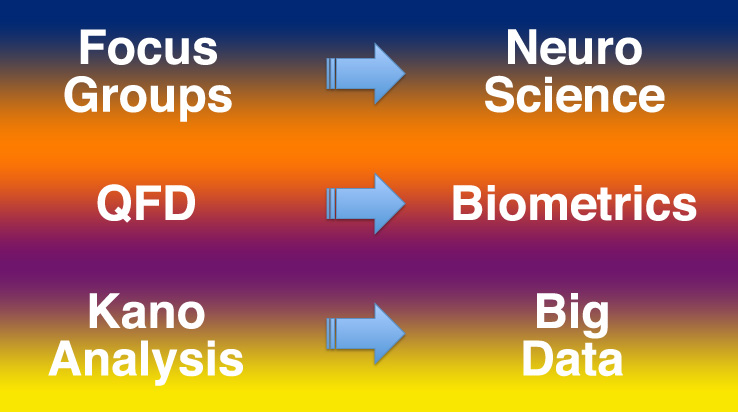
Benchmark Metrics: Remember the days when a thumbs-up or thumbs-down rated the product, well it is way more complicated today. And many global products need their own nuances, as cultures and geographies have their own norms, everything from form to colors to interfaces. Three decades now into The Third Coming, some metrics have stood the rigors of time and are useful assessments of product design and its value in the marketplace. In the past half-dozen years, a number of new benchmark indices have arisen from the likes of DMI, McKinsey, and others that indicate the value of design to corporations and the financial premium that good design engenders on Wall Street.
The Value of Product Design: This spring, GGI produced three one-hour programs that focus on The Third Coming, design techniques that generate disproportionate value, management techniques to reap the most value from design, and the metrics and benchmark indices that have risen to the top. These programs are not some flavor-of-the-day, they result from diligent research and industry observations on best design companies and industries. The material focuses on companies that design physical and internet products with user interfaces. GGI positioned the programs to be relevant now and several years into the future. Twenty topics are covered. There are 4-5 minute overview videos that take you through the table of contents for the Series and for each program.
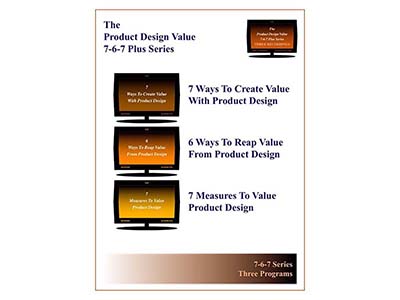
The Product Design Value 7-6-7 Series
7 Ways To Create Value From Product Design
6 Ways To Reap Value From Product Design
7 Measures To Value Product Design
Measuring Product Development Productivity and R&D Performance: Consider joining us in London on November 5-6 for our two-day Masterclass sponsored by MOAS and Planisware. We’ll be taking a comprehensive look at measuring product development and its results, including a new mini-module that discusses our findings in 7 Measures To Value Product Design spanning both program and corporate management. There is a 4-minute overview video on the Masterclass landing page.
••••••••••••••••••••••••••••••••••••••••••••••••••••••••
Follow us on Twitter @GoldenseGroup
••••••••••••••••••••••••••••••••••••••••••••••••••••••••
The Third Coming of Product Design and Benchmark Metrics Read More »


