2014

Top 25 Corporate R&D-Product Development Metrics Now Focus On Portfolio, Pipeline, and Profits

GGI’s sixth primary research study of the Top 100 R&D and Product Development Metrics in North America, published on March 3, 2014, found notable shifts in Key Performance Indicators (KPIs) for R&D and Product Development in the past five years.

Innovation functions have been increasingly measured in business terms since the late 1980s, but the balance of the Top 25 KPIs remained internal to the function and were not business-focused.  In 2008, the balance became roughly even.  In 2014, the balance tipped. Industry now measures the product portfolio as it evolves in the pipeline with ten metrics that span end-to-end.  Three metrics measure ROI, IRR, NPV, or Payback. Three metrics measure revenues.

In addition, there are two measures of new product profits.  Average First-Year Profits of New Products joined Percent of Profits From New Products.  Both profit measures have been steadily rising in their adoption since the early 2000s.  Prior to 2000, profit measures were not present in the Top 25.  Perhaps the hardest KPI to accurately measure, this finding indicates that companies have increased their depth of understanding regarding their hard to quantify innovation functions.

The final seven measures focus on internal management of R&D, such as: Time-To-Market, Development Cost, R&D Spending, and measures of Headcount.

Movement in the remaining 75 metrics over GGI’s six studies indicates that measures of Intellectual Property (IP), Licensing, and IP Revenues and Profits will likely displace some of the current Top 25.

R&D still lags other business functions in its cross-industry measurement equivalency. Only seven KPIs are common across more than 40% of industry, and only fourteen KPIs are common across more than 30% of industry.  KPI #25 is common across only 17% of industry.  In comparison, other functions may have 70% or more KPI equivalency across industries.

GGI’s sixth study also researched changing trends in the R&D Operating Environment, Organic Innovation, Open Innovation, and Intellectual Property.

The complete findings of the research are available. They are being used to augment GGI’s executive education curriculum, ongoing since 2005, on Metrics and Innovation.  A Summit on Corporate Metrics will be held December 9-11, 2014. A Summit on Corporate Innovation will be held April 7-9, 2015.

18th R&D-Product Development Metrics Summit, December 9-11, 2014

This 18th Summit will provide participants with the best metrics for their individual companies across industries to drive R&D and Product Development productivity, output, effectiveness, and efficiency.  You will wrap your arms around the metrics that investment firms and Wall Street analysts are increasingly interested in regarding new product sales, value of the pipeline, time-phased portfolio value, company innovativeness, and innovation conversion rates to real products that launch.  Make no mistake, this Summit is geared for top folks chartered with leading and getting results from innovation in all its manifestations.  If you look at the written testmonials from our Summit participants, and the positions that they hold, it is clear that GGI’s Summit delivers the value and content that executives charged with running complex R&D operations need to be successful.

Our twenty-eight years as a corporation serving North America and Europe, along with our statistically valid primary research conducted over the past fifteen years, brings depth and executive perspective this 18th Summit.  We know the Top 100 Metrics that are the most used by corporations, and how they have changed over time.  On March 13, 2014 GGI published our 6th North American study of R&D and Product Development practices in the areas of R&D Operating Environments, Organic Innovation, Open Innovation, Intellectual Property, and the Top Corporate R&D Metrics In Use. Two-hundred companies from the USA, Canada, and Mexico participated in numbers that represent the relative R&D spending of the North American countries. There is no more current information anywhere on the industrialized continents in 2014. Participants in our 17th Summit earlier this year attested to this.  Again, GGI Summits are delivered from the prospective of C-Level executives who have overall responsibility for getting results and/or interfacing with external analysts.

During the first two seminars of the Summit, we will discuss the usable and practical part of the Body of Knowledge of R&D and Product Development Metrics that CXOs can put to work for their companies.  The first seminar, the first day, focuses on the hardest to measure operational areas including: capacity management, how to make trade-off decisions, hurdle rates, portfolio risk and complexity, overall returns from R&D investments, and the number of metrics a company should have to manage R&D from a CXO and then CEO level.  The second seminar, the next morning, focuses on planning, proactive, and predictive metrics that enable one to see ahead of actual results to enable a performance environment and culture that will produce superior results.

The third seminar of the Summit is best described as a Workshop, but it will include new material on rapidly evolving measurement areas in R&D.  Participants will break into working groups to apply their experience and new learnings of the past two days to create “a set of metrics” suitable for measuring all aspects of R&D — including Projects, Technical & Functional Disciplines, Improvement Initiatives, and most importantly the overall CXO-Level metrics for R&D that are used by the President, CEO, and investor community.   There will be several focused discussions during the Workshop on specialty metrics for Advanced Development, Functional/Technical Competencies, Intellectual Property & Licensing, and several other measurement topics that are rapidly entering the mainstream.

Senior executives wishing to put themselves and their fellow senior executives in a better position to direct and drive product creation and commercialization should strongly consider attending. The great majority of our prior participants will say, “this Summit covers everything an Officer or Senior Manager needs to know on the subject of Metrics and how to deploy them.”


18th R&D-Product Development Metrics Summit

 Early Bird Rates conclude at the end of business Pacific Time Friday, October 10.

 There are significant discounts for Individual registrants.

Companies that register Teams of three or more people
get even better discounts
that recognize their commitment to the Summit.


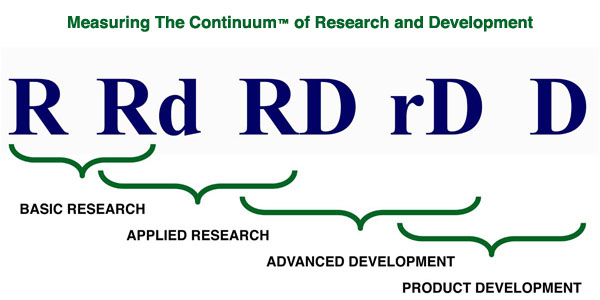
Measuring The Continuum of Research and Development

The Top 10 and Top 100 Corporate R&D and Product Development Metrics

The July 7, 2014 issue of 2PLM introduced the scope and focus of recent Goldense Group Inc. (GGI) research on R&D Operating Environments, Organic Innovation, Open Innovation, Intellectual Property, and “The Top Corporate Metrics used to measure R&D and Product Development”.

At GGI, our goal in each primary research effort during the past fifteen years has been to focus four areas of the research effort on emerging new practices, or on rapidly evolving or changing existing practices, to learn rates of change and/or growth.

In our recent research effort, the “2014 Product Development Metrics Survey”, the four topics of R&D Operating Environments, Organic R&D Innovation, Open R&D Innovation, and R&D Intellectual Property Practices were chosen as they satisfy those parameters. In addition, they are having an impact on the R&D metrics that corporations use.

The July 21, August 4, August 25, and September 8 issues of 2PLM addressed the research findings regarding these four areas.

In this sixth and final piece of the six part series, the research purpose is more akin to benchmarking than to discovering new and changing industry practices. In each research effort of the past fifteen years, our researchers have presented a list of the “metrics that CXOs are most likely to use to oversee R&D output, productivity, effectiveness, and efficiency.” Respondents are asked simply to put a check mark next to any metric that is generally part of management team and corporate reviews. The “Most Frequently Used Corporate R&D Metrics” results from tabulating the responses. The list of metrics is far from static over the past fifteen years.

This article may be found at:

The Top 10 and Top 100 Corporate R&D and Product Development Metrics

The pages at which 2PLM is published are:

Current Issue

Main 2PLM Portal

2PLM is a bi-monthly publication by John Stark Associates [JSA], based in Switzerland. JSA is focused on the body of knowledge of “Closed Loop Lifecycle Management (CL2M).” JSA and GGI have collaborated on various projects spanning three decades, including GGI’s primary research initiatives.

——————-

A note on GGI primary research initiatives:

The six GGI primary research initiatives during the the past fifteen years may be found at GGI’s Primary Research site.

The 2014 primary research, entitled the “2014 Product Development Metrics Survey”, was conducted by sending questionnaires to a wide range of companies developing products throughout North America. Participating companies had headquarters throughout the Americas, Europe, and Asia, but their response was for North American R&D-Product Development operations. Complete data sets were received from 200 companies. Consumer, industrial, medical, chemical, and automotive/vehicular products were the top respondent industries. Participants completed 31 questions across the five primary research subjects. The research period was September 2012 to October 2013. The results were published March 3, 2014 in a 138-page report. This research is statistically valid and provides a Margin Of Error for each research question.

The Enculturation of Intellectual Property In R&D Practices Is Coming

In the July 7, 2014 issue of 2PLM, the scope and focus of recent research on R&D Operating Environments, Organic Innovation, Open Innovation, Intellectual Property, and the Top Corporate Metrics used to measure R&D and Product Development was described. The July 21, August 4, and August 25 issues issues addressed the industry research findings regarding R&D Operating Environments,  Organic R&D Innovation, and Open R&D Innovation respectively.

In this fifth of a six part series, selected GGI findings on Intellectual Property practices in R&D will be discussed.  Intellectual Property [IP], for the purposes of the research, included both registered and unregistered IP associated with R&D. Company Proprietary, Trade Secret, Enabled Publications, Copyright, Trademark, Provisional Patent, and Patent were generally the categories that respondents had in their minds as they addressed eight research areas spanning R&D and the general management of IP.ources, excluding the use of contracted personnel to supplement employee-equivalent responsibilities.

Four IP areas relating to R&D and PLM were researched: Importance of IP, Financial Tracking of IP, Financial Results from IP, Processes Used To Manage IP. Over 95% of all respondent companies provided answers to these four research areas. As “IP” has been around for centuries, and registered IP began in England in the Middle Ages, one would expect a high level of corporate awareness on the subject of Intellectual Property.

This article may be found at:

The Enculturation of Intellectual Property In R&D Practices Is Coming

The pages at which 2PLM is published are:

Current Issue

Main 2PLM Portal

2PLM is a bi-monthly publication by John Stark Associates [JSA], based in Switzerland. JSA is focused on the body of knowledge of “Closed Loop Lifecycle Management (CL2M).” JSA and GGI have collaborated on various projects spanning three decades, including GGI’s primary research initiatives.

——————-

A note on GGI primary research initiatives:

The six GGI primary research initiatives during the the past fifteen years may be found at GGI’s Primary Research site.

The 2014 primary research, entitled the “2014 Product Development Metrics Survey”, was conducted by sending questionnaires to a wide range of companies developing products throughout North America. Participating companies had headquarters throughout the Americas, Europe, and Asia, but their response was for North American R&D-Product Development operations. Complete data sets were received from 200 companies. Consumer, industrial, medical, chemical, and automotive/vehicular products were the top respondent industries. Participants completed 31 questions across the five primary research subjects. The research period was September 2012 to October 2013. The results were published March 3, 2014 in a 138-page report. This research is statistically valid and provides a Margin Of Error for each research question.

Design Reviews Reduce Time to Market

Making Product Development Processes More Innovative [Machine Design – August 14, 2014] discusses ways that corporations can build more “innovation-think” time into their product development processes.  The article primarily focuses on improving the balance of activities that are required by company product development processes.

If capacity and throughput in Manufacturing and Production is accurately quantified as “equipment assisted by people,”  then R&D and Product Development is accurately quantified as “people assisted by equipment.” Paying attention to the specific activities that are required of development professionals is a key contributor to R&D productivity and throughput, more so than just about any function.  R&D-Product Development headcount is a single digit percentage of the work force that is required to generate fifteen to sixty percent of near and intermediate term revenues.  Time is a critical commodity.

Today’s product development process structures, many whose underpinnings date to times when digital simulation and testing were a very expensive commodity and there were far less computer models and illustrations on the shop floor, also bear a legacy of having test suites whose center of gravity and resultant corporate culture is after the product exists in physical form.  As such, Design Reviews last almost up to product launch.

Thinking best practices, physical form is late.  In physical form, one is answering a more reactive Quality Control question “does the as-built model conform to the requirements and specification?”  If yes, phew.  If no, as is usually the case, changes are required that can ripple through the entire supply chain.  Changes certainly take engineering time. These are not really Design Reviews.   Design reviews are reviews of design.

Analogous to re-balancing required pipeline activities to improve innovative thinking and new product creation potential, re-balancing a late center of gravity will also free time and energy for potential new product creation.

Design Reviews Reduce Time to Market [Machine Design – September 4, 2014] discusses how R&D-Product Development time can be saved by performing early and meaningful Design Reviews to help overcome legacy testing suites and a culture whose gravity is late into the process.  An ounce of prevention is worth a pound of cure.  Design Reviews result in a more productive, collaborative, and satisfied R&D-Product Development community.

NOTE: The article is currently posted. The MD September 4 magazine issue URL will enliven when the issue is published.

The Embodiment of Open R&D Innovation Management Begins

In the July 7, 2014 issue of 2PLM, the scope and focus of recent research on R&D Operating Environments, Organic Innovation, Open Innovation, Intellectual Property, and the Top Corporate Metrics used to measure R&D and Product Development was described. The July 21 and August 4 issues addressed industry research findings regarding R&D Operating Environments and corporate practices in Organic R&D Innovation.

In this fourth of the six part series, published on August 25, selected GGI findings on Open R&D Innovation will be discussed. Open Innovation [OI] is the ability of a corporation to invent and innovate using outside sources and resources, excluding the use of contracted personnel to supplement employee-equivalent responsibilities.

Open Innovation is a two way street. GGI coined “Inbound Open Innovation” and “Outbound Open Innovation” to segment the research. If a company looks to make its capabilities available to other companies that may have an interest, that is Outbound. If a company is looking to acquire innovation to supplement its own Organic R&D Innovation capabilities, or perhaps to repackage and sell acquired innovation, that is Inbound. This article focuses on Inbound OI.

Five Inbound OI areas were researched: Importance of OI, Financial Tracking of OI, Financial Results from OI, Corporate OI Approaches To Acquire Capabilities, and Processes Used To Manage OI. Over 95% of all respondent companies provided answers to these research areas. That, in itself, is an indication that this evolving body of knowledge is likely to have staying power in the years ahead.

This article may be found at:

The Embodiment of Open R&D Innovation Management Begins

The pages at which 2PLM is published are:

Current Issue

Main 2PLM Portal

2PLM is a bi-monthly publication by John Stark Associates [JSA], based in Switzerland. JSA is focused on the body of knowledge of “Closed Loop Lifecycle Management (CL2M).” JSA and GGI have collaborated on various projects spanning three decades, including GGI’s primary research initiatives.

The six GGI primary research initiatives during the the past fifteen years may be found at GGI’s Primary Research site.

The 2014 primary research, entitled the “2014 Product Development Metrics Survey”, was conducted by sending questionnaires to a wide range of companies developing products throughout North America. Participating companies had headquarters throughout the Americas, Europe, and Asia, but their response was for North American R&D-Product Development operations. Complete data sets were received from 200 companies. Consumer, industrial, medical, chemical, and automotive/vehicular products were the top respondent industries. Participants completed 31 questions across the five primary research subjects. The research period was September 2012 to October 2013. The results were published March 3, 2014 in a 138-page report. This research is statistically valid and provides a Margin Of Error for each research question.

The Sophistication of Organic R&D Innovation Management Continues

In the July 7, 2014 issue of 2PLM, the scope and focus of recent research on R&D Operating Environments, Organic Innovation, Open Innovation, Intellectual Property, and the Top Corporate Metrics used to measure R&D and Product Development was described. The July 21 issue addressed R&D Operating Environments.

In this third of the six part series, published on August 4, selected GGI findings on Organic R&D Innovation will be discussed. Organic Innovation is the ability of a corporation to invent and innovate from within, including the use of contracted personnel to supplement employee-equivalent responsibilities.

Three Organic R&D Innovation areas were researched: Types of R&D Performed, R&D Processes for Pre-Product Development Innovation, and Product Development Processes. All three of these areas were researched thoroughly in our 2008 study enabling a pre/post great recession analysis.

This article may be found at:

The Sophistication of Organic R&D Innovation Management Continues

The pages at which 2PLM is published are:

Current Issue

Main 2PLM Portal

2PLM is a bi-monthly publication by John Stark Associates [JSA], based in Switzerland. JSA is focused on the body of knowledge of “Closed Loop Lifecycle Management (CL2M).” JSA and GGI have collaborated on various projects spanning three decades, including GGI’s primary research initiatives.

The six GGI primary research initiatives during the the past fifteen years may be found at GGI’s Primary Research site.

The 2014 primary research, entitled the “2014 Product Development Metrics Survey”, was conducted by sending questionnaires to a wide range of companies developing products throughout North America. Participating companies had headquarters throughout the Americas, Europe, and Asia, but their response was for North American R&D-Product Development operations. Complete data sets were received from 200 companies. Consumer, industrial, medical, chemical, and automotive/vehicular products were the top respondent industries. Participants completed 31 questions across the five primary research subjects. The research period was September 2012 to October 2013. The results were published March 3, 2014 in a 138-page report. This research is statistically valid and provides a Margin Of Error for each research question.

The Great Recession Changed R&D Operating Environments

In the July 7, 2014 issue of 2PLM, the scope and focus of recent research on R&D Operating Environments, Organic Innovation, Open Innovation, Intellectual Property, and the Top Corporate Metrics used to measure R&D and Product Development was described.

In this second of the six part series, published on July 21, selected GGI findings on R&D Operating Environments are discussed.

Four R&D Operating Environment areas were researched: R&D-Product Development Strategy, Importance of Innovation, Centralization vs. Decentralization, and Facility Deployment. Several of these areas were researched thoroughly in our 2008 study enabling a pre/post great recession analysis.

This article may be found at:

The Great Recession Changed R&D Operating Environments

The pages at which 2PLM is published are:

Current Issue

Main 2PLM Portal

2PLM is a bi-monthly publication by John Stark Associates [JSA], based in Switzerland. JSA is focused on the body of knowledge of “Closed Loop Lifecycle Management (CL2M).” JSA and GGI have collaborated on various projects spanning three decades, including GGI’s primary research initiatives.

The six GGI primary research initiatives during the the past fifteen years may be found at GGI’s Primary Research site.

The 2014 primary research, entitled the “2014 Product Development Metrics Survey”, was conducted by sending questionnaires to a wide range of companies developing products throughout North America. Participating companies had headquarters throughout the Americas, Europe, and Asia, but their response was for North American R&D-Product Development operations. Complete data sets were received from 200 companies. Consumer, industrial, medical, chemical, and automotive/vehicular products were the top respondent industries. Participants completed 31 questions across the five primary research subjects. The research period was September 2012 to October 2013. The results were published March 3, 2014 in a 138-page report. This research is statistically valid and provides a Margin Of Error for each research question.

Brad Goldense Appointed Technical Expert By Penton Publishing

Penton Publishing has quietly been executing a corporate initiative across its featured magazines, the appointment of “Contributing Technical Experts.”  GGI is pleased to share with you that Bradford L. Goldense, founder and president of GGI, has been appointed a Contributing Technical Expert for Penton’s Machine Design magazine.

Mr. Goldense has a B.S. in Civil Engineering from Brown University and an MBA from Cornell University.  He holds four professional certifications:  New Product Development Professional [NPDP] from PDMA, Certified Manufacturing Engineer [CMfgE] from SME, Certified In Production and Inventory Management [CPIM] from APICS, and Certified Computer Professional [CCP] from ICCP.  Brad taught in the graduate engineering school, The Gordon Institute, at Tufts University for nineteen years.  Mr. Goldense has consulted to over 250 industrial and high tech companies in over 700 manufacturing locations over his thirty-five year career.  He holds over two-hundred registered copyrights.  His work has been published by The Economist Group, Business Week, Industry Week, CFO Magazine, and numerous other trade publications. Goldense Group, Inc. [GGI], founded in 1986, is a consulting, market research, and executive education firm located in Needham, Massachusetts.

Mr. Goldense’s recent articles will be featured on Machine Design’s home page. His contributions will be maintained in Machine Design’s archives.

Applied Research & Advanced Development Come Of Age

Innovation is Changing Pre-Product Development R&D [Machine Design – September 5, 2013] addressed the widespread growth over the past dozen years in industry innovation activities that precede product development. Historically, only companies in the  life sciences industries and a handful of others commit significant resources prior to product development. Today, three-quarters of all companies have innovation and design resources engaged in development before they have defined products that go through product development processes.

Applied Research & Advanced Development Come Of Age [Machine Design – July 17, 2014] discusses corporate efforts and approaches to evolve the creative and innovation development activities that eventually lead to Product Development activities.

READER NOTE:  The URL for July 17 will become active when Machine Design’s July issue is published on the 17th.  The article was posted on June 23.

Product Architecture In The Digital Age

In the late 1980s and early 1990s, industry aggressively sought to understand the correlation between product requirements and product outcomes. HP, IBM, Corning, Northern Telecom, Motorola, Analog Devices, and a few others led multi-faceted multi-year campaigns to understand the correlation. An article by Ashok Gupta in California Management Review’s Winter 1990 issue best captured the findings. In short, 71% of what goes wrong in product development can be traced to missing or incomplete or inaccurate requirements.

During these years, except for mission critical and complex systems requiring zero-defect or fail-safe outcomes, the responsibility for product requirements began migrating away from technical functions to marketing and product management organizations to improve corporate abilities to unilaterally focus on them. Product champions became the stars.  The number of technical professionals involved in defining requirements gradually declined, as did their architectures.

Think about that 71% figure. It implies three out of four errors in product development are at least partially avoidable by good up-front planning and analysis. Younger readers may say, “looks like some old fogie is writing the article. We can be agile, rational, scrum, and sprint! And software is easier to modify, more flexible, and better all around.”

That’s all well and good, but the number of designs that are “spaghetti-like” in their architecture has been increasing. Requirements rarely ever arrive in a single package at the same time these days. Isn’t that necessary for a robust architecture? Sure the wizards get the rabbit out of the hat and make the product work, somewhat. But are we giving our companies and customers a best-in-class product? Missed, incomplete, and misinterpreted requirements are the ingredients that go into spaghetti architectures.

We should learn from history and ensure technical professionals again get heavily involved in the requirements definition and management process. We should emphasize strong relationships between product architecture, systems, and technical professionals, and the product or marketing organizations now responsible for defining requirements.

Product Architecture In The Digital Age [Machine Design – June 12, 2014] discusses industry’s movement away from systems engineering approaches that brought both technical and customer requirements together at the beginning of a new product development project.

18th R&D-Product Development Metrics Summit – December 9-11, 2014

This Summit will provide participants with a snapshot of the evolution, current status, and projected future of R&D and Product Development Metrics as viewed from the top of corporations.

During the first two seminars of the Summit, we will teach the Body of Knowledge of R&D and Product Development Metrics — with a focus towards the measures that company Officers and Senior Executives need to manage the organization and its performance as a whole. The first one-day seminar is dedicated to focus on the metrics for decisions and issues that Officers and Senior Executives face in directing and measuring overall performance and entire organizations. The three most adopted industry metrics of the past decade will be discussed, along with a number of other all-in-one metrics: 3M’s “Vitality Index,” the emergent “Return On Innovation” metric, and the rejuvenated “Return On Capital.” Capacity, pipeline and portfolio management, hurdle rates, risk, and trade-off analysis discussions round out the first day. The second seminar, a half-day concluding with an early afternoon luncheon, is dedicated to “proactive” and “predictive” metrics. Proactive metrics lower the risk of R&D investments before they are approved. Predictive metrics improve the ability to foresee the execution and financial outcomes of approved investments.

During the third and final seminar of the Summit, participants will break into working groups to create a “set of metrics” suitable for managing and monitoring R&D and/or Product Development organizations as a whole — including Projects, Technical & Functional Disciplines, Improvement Initiatives, and the overall Corporate Performance of R&D. Applied Research and Advanced Development organizations are easily accommodated as well in a single integrated framework, for companies with multiple development organizations. The Linked Metrics Portfolio® approach, preferred to the Balanced Scorecard for managing R&D and Product Development, will frame the exercise.

Senior executives wishing to put themselves and their fellow senior executives in a better position to direct and drive product creation and commercialization should strongly consider attending. Several of our prior participants have said, “this Summit covers everything an Officer or Senior Manager needs to know on the subject of Metrics.” GGI, a 28-year old company, has been recognized as a thought leader and practitioner in this field since the early 1990s.

Finally, and this is not true of all GGI Metrics Summits, GGI published our 6th North American study of R&D and Product Development practices in the areas of R&D Operating Environments, Organic Innovation, Open Innovation, Intellectual Property, and the Top Corporate R&D Metrics In Use on March 3, 2014. Two-hundred companies from the USA, Canada, and Mexico participated in numbers that represent the relative R&D spending of the North American countries. It will be difficult to find information that is more current to augment the practical nature and usable outcomes of this 18th Metrics Summit.

Please visit our Summit web site for additional content and registration information.

Top 5 R&D-Product Development Metrics

Organic R&D-Product Development, Open Innovation, Intellectual Property & CXO Corporate Metrics Practices, July 23, 2013, announced GGI’s 6th major industry research study since 1998. The 6th study had begun in September of 2012 and was subsequently concluded in September 2013, lasting approximately 13 months. Two-hundred North American companies participated in equal ratios to the relative R&D Spending of the USA, Canada, and Mexico. A sizable research effort, analysis and report writing took several months. On March 13, 2014, GGI issued a Business Wire Press Release to announce the 2014 Product Development Metrics Research.

Each GGI research effort has five focus areas. We try to get at what we see or know to be emerging trends to determine if they will become generally adopted, or if they will fizzle out. Advisors always wish to bring novelty and sizzle to their clients. GGI’s research gives us additional confidences, yea or nea.

The first four research areas explored changes to the environment and processes of organic R&D, open innovation, and intellectual property. Several of our thirty-one questions enabled five and ten year snapshots versus our prior research; and enabled comparisons of pre and post great recession practices. These four areas are not on the subject of Top 5 Industry R&D-Product Development Metrics. In short, innovation infrastructure is actively being built while the mix of corporate product portfolios clearly have less risk. Seemingly, corporate control from inception to launch has is probably best yet. There is little R&D sandbox left that is not overseen with some sort of milestones. New-To Innovation? IP is growing in personnel, but most infrastructure appears to be delivered by outside services. As well, integration with the general employee population seems slow compared to the continued growth in IP market dynamics.

The fifth and final research area has remained consistent for fifteen years now. GGI always studies industry usage of “Corporate R&D-Product Development Metrics.” What dashboard metrics are the top executives using these days, and what is changing over the past 5-10-15 years? This study researched 101 individual metrics. All 101 metrics are exclusively “overall performance metrics for R&D-Product Development as a whole,” the ones CEOs might wish to look at along with their VP R&D-Product Development. We had to limit the number to 101. Industry usage of known metrics, and now many permutations thereof, is exploding. Enabled by the computer age, many more metrics are possible and the cost per metric is lowering.

Leeland Teschler, Machine Design’s long-time Editor, excerpted a piece he entitled the State of R&D shortly after GGI’s research was published. It includes the Top 5 metrics.

Top 5 R&D-Product Development Metrics [Machine Design – May 8, 2014] breathes a bit more life into the nature of the Top 5 metrics, one of which didn’t exist thirty years ago.

Corporate Innovation Now Focused On Business Results

NEEDHAM, Mass. — (BUSINESS WIRE) — March 13, 2014 — Goldense Group, Inc. [GGI] announced the completion of its sixth primary research initiative on the strategies, processes, practices, and metrics used in North American R&D and Product Development Innovation. This study focused on R&D Operations, Organic Innovation, Open Innovation [OI], Intellectual Property [IP], and the Top 100 Productivity & Performance Metrics used by corporations.

Two hundred companies from the US, Canada, and Mexico participated in equal proportion to the relative R&D Spending of these three countries, representative of North America. The response rate was 6.5%. A typical respondent company had US$ 4-5B in revenues.

While the relative corporate activity in Basic Research, Applied Research, Advanced Development, and Product Development remained largely constant for the past five years, the infrastructure in these areas experienced significant growth. Growth will continue. Two-thirds indicated innovation will be more important in the next five years than in the past five. Half indicated the same for OI.

The emerging OI and IP marketplaces, corporate enablers to monetize soft assets, continued to grow. Scouting and innovation intermediary firms achieved 15% penetration. Joint innovation ventures are reported by more than a third of respondents. Corporate abilities to track revenues and profits lag abilities to track costs, this is especially true for OI.

Seventy percent indicate that IP will be more or much important in the next five years. Three quarters indicate that the financial impact of IP is positive, none indicated negative. Over a third indicated they have formalized processes for monetizing IP. Thirty percent are changing their Trade Secret practices, now that First-To-File has become law in the United States.

After fifteen years of little change in corporate metrics for R&D and Product Development, there has been a sea change in the use of metrics to focus on business results in the past five years. The “R&D sand box” is almost gone. Twenty-three of the Top 25 metrics now measure pipeline attributes, productivity, and results.

These findings are excerpts from two available reports on GGI’s 2014 Product Development Metrics Survey. Findings are also located in Driving Product Development™ and Tangible Innovation!™, and will be discussed at the 17th R&D-Product Development Metrics Summit being held April 15-17, 2014 in Norwood, Massachusetts.

Predictive Metrics for Projects & Programs

Measuring Competencies In Lean & Innovative Companies, October 16, 2013, focuses on metrics that are part of the Functional/Technical subgroup of metrics. Projects/Programs, Improvement, and culminating Corporate-Level metrics are the other subgroups. Competency measurement, without yet being statistically shown, will be ultimately be shown to correlate with corporate success.

Another group of metrics that will ultimately be shown to correlate with corporate success are the metrics that are “Proactive & Predictive” for projects and programs. GGI is credited with codifying a group of metrics that precede a go-no go approval decision that take risk out of projects and their resultant products, and coining them as Proactive. In sequence, Predictive metrics begin at project/product approval and generally cease when an initial form and function prototype is realized. Predictive metrics compare updates against the approved plan to track deviation or convergence. Together, both Proactive and Predictive metrics are quite useful in eliminating risk and variation in the pre, early, and mid stages of R&D investments.

The vast majority of all R&D spending across the globe is directed to project and programs. Relative to all other categories and types of R&D measurement, excepting the same types of metrics for products, metrics that enable the ability to show what might, could, or will happen to the volume of spending on projects and programs are perhaps the most important. Practically speaking, if a company performs poorly on a project, it is immediately visible within the company. If less than desired performance continues across multiple projects over time, performance usually becomes visible in the products emanating from the company and begins to affect branding, reputation, and pricing. A company can typically recover from a single product that does not live up to expectations. But, when the “product development factory of projects and programs” falls short of expectations multiple times the impact on products and the portfolio is rarely escaped.

Will we ever get to the level of process control over WIP that we now enjoy in manufacturing and other operations functions? Certainly not, nor do we wish to do so. Necessarily we wish to have more probability and variability in product development or we would quash innovation.

Today though, we still suffer way too much air time discussing the metrics that account for “what has happened.” Yes, these “reactive” metrics have a place. It is necessary to measure and record what has or did happen. Reactive metrics also play quite well to the capabilities of North American professionals, who are generally world class problem fixers. A key remaining opportunity for project and program measurement is to develop better proactive and/or predictive correction abilities.

What should or can be measured, early in the cycle, that will give actionable indications that the promised results for the project or the product are deviating from or converging to plans and promises? Is there even one measure in existence today that can be taken early in product development that has been shown to have a 1:1 correlation with the promised plan or output? Not yet. Operations, finance, sales and other company areas have such measures though. Relatively speaking, the science of R&D project and program metrics and measures still has some greenfield in front of it in comparison to the measurement proficiencies that other business functions have attained for the monies and capital entrusted top them.

Predictive Metrics for Projects and Programs [Machine Design – November 7, 2013], delves more deeply into a subject that will be on the front burner of corporations in the years ahead. The corporations that are the first to master early correlating measures of plans and promises to actual outcomes will gain a competitive advantage until the management science becomes widely understood.

R&D Metrics For Manufacturers: Measuring Your Productivity

On April 3, 2014, GGI will be presenting a webinar in conjunction with Lorman Education Services entitled “R&D Metrics For Manufacturers:  Measuring Your Productivity.”  A number of topics will be discussed, including “New Process-Ware Preceding Stage-Gate,” “Emergent Innovation-Age Metrics,” and “State-Of-The-Industry R&D Metrics Practices In 2013.”

GGI has just completed a primary research study of 200 companies in North America that will be published in early 2014.  This webinar will include information from several areas of the research related to “R&D Operating Environment,” “Organic Innovation,” and “Top Corporate Metrics Used In Industry R&D Practices.”

Some highlights of our planned discussion on April 3 will hopefully entice you to spend an hour with us starting at 1:00 PM CDT.  This blog post will be updated at the bottom of this post with the registration details and codes when they become available.

WEBINAR OVERVIEW

Globalization, business alliances, open innovation, and improved improved organic innovation initiatives to gain strategic advantage in this era of global competition are driving significant changes in measurement practices for innovative functions. The depth of the recent recession augmented the rate of change.

GGI has been tracking the R&D and Product Development metrics used by industry for twenty-five years, and regularly for the past fifteen years.  Our 2013 findings indicate that there is now a clear industry-wide focus for R&D metrics to address business results. That has not always been the case. “Business results” does not equate to conservative portfolios either. There are more risk monies being spent.  But, a plethora of newly developed processes to oversee risky and exploratory activities now keeps a business focus on these early stage activities; and is causing a need for new metrics. The sand box definitely shrunk in the past five years.  The entire pipeline portfolio is receiving increased scrutiny.

Shifts in the priority of a number of measures towards measuring business results have been on track since the 1990s at a slow pace.  Our 2008 findings indicated some type of inflection point in real priorities was nearing.  A comparison of the same twenty-five metrics between 2008 and 2013 shows a clear priority shift, that will likely be permanent.

Finally, intellectual property is increasingly being used as a revenue and profit generation tool; and as a revenue and profit protection tool.

In summary, R&D productivity improvements are being driven by a combination of “business environment” factors and the “maturation of the monetizable IP marketplace.”  Existing metrics are being elevated or demoted to support today’s needs and opportunities.  New metrics are being created to measure R&D areas that have not previously existed, or were not of a size or importance that warranted corporate measurement.


WEBINAR AGENDA

I.  R&D Management Evolution & Revolution

  • Timeline 1940-2025
  • Best Practice Process Execution
  • New Basic & Applied Research and Advanced & Product Development Practices
  • New Process-Ware Preceding Stage-Gate Is Spreading Across Industry

II. Emergent Innovation-Age R&D Metrics

  • Vitality Index
  • A Metric For The Hockey Stick and The Chasm
  • Return-On-Innovation
  • Research & Development Effectiveness Index
  • Advanced Development Return-On-Innovation
  • Applied Research Return-On-Innovation
  • Case Study: A Top 10 Global Innovator
  • Return-On-Capital

III. State-Of-The-Industry R&D Metrics Practices In 2013

  • Top Twenty-Five Corporate R&D Measures in 2013
  • Top-Twenty Five Comparison Pre-Recession 2008 to Post-Recession 2013
  • Continuing Commercialization Issues
  • R&D Metrics Penetration Changes 1998-2013
  • R&D Metrics Penetration In The Coming Decade

IV. Recommendations

  • Effectiveness Metrics Outperform Efficiency/Productivity Metrics In Value Generation
  • Sigma-Level Portfolio & Pipeline Control That Maximizes Business Value


WEBINAR REGISTRATION

Please check back.  The URLs for further information, registration codes and details, and possible discounts will be located here when they become available.  Thank you for your patience.

If you have been considering GGI’s Summits, this might be a good way to see if spending three days with us will help to achieve your goals.