Tactics

The Third Coming of Product Design and Benchmark Metrics

The history of product design begins in the 15th century, as the Middle Ages were transitioning to the Renaissance. Italian architects and shipwrights introduced the use of drawings to build ships. Craftsmen throughout Europe began creating “pattern books” enabling artisans in other geographies to replicate desirable products and designs. This basic model stayed in place until the late 19th century, the beginning of the Industrial Revolution.

As mass production began to take hold, product design optimized manufacturability and producibility. Practicality ruled, but it also resulted in bland utilitarian visuals. Competitive forces then took hold as multiple companies that could now produce equivalent products at the same price and quality needed a new differentiating factor.

The First Coming: Individual experts began emerging in the late 1800s. Christopher Dresser (1834-1904) is generally credited with being the first “designer.” He was widely known and many companies sought his talents. The Rhode Island School of Design was founded in 1877 to address the growing demand for best designs. In 1919, Joseph Claude Sinel (1889-1975) proclaimed himself an “industrial designer” and the profession began. But, it was not until The Carnegie Institute of Technology introduced the first “industrial design degree” in 1934 that the profession began to scale.

The Second Coming: The formation of companies whose mission focused on design began in the 1920s, e.g., Alessi (1921) and Teague (1926). The formation of Design Concepts (1967) and Frogg Design (1969) triggered an industry that would form well into the 1990s, e.g., RKS (1980), Continuum (1983), Seymourpowell (1984), KartenDesign (1984), and IDEO (1991). The formation of professional and trade organizations paralleled the growth of degrees in academia and many people now having the profession, e.g., Industrial Designers Society of America (1965) and Design Management Institute (1975). Manufacturers now contracted and partnered with design companies to bring about best designs.

The Third Coming: Critical mass was achieved in the late 1980s. Many people were now expert in industrial and product design. What next then? Specialization of course! This is where we find ourselves today. We now have specialists for materials, for designs in certain industries or in different technologies, for artistic vs. mechanistic, for physical vs. software products, for traditionally produced vs. 3D Printed products, and more. User Interface is a great example. We now distinguish between User Interface and User Experience and Customer Experience. The Venn diagrams overlap, but there is a discipline in each area.

Benchmark Metrics: Remember the days when a thumbs-up or thumbs-down rated the product, well it is way more complicated today. And many global products need their own nuances, as cultures and geographies have their own norms, everything from form to colors to interfaces. Three decades now into The Third Coming, some metrics have stood the rigors of time and are useful assessments of product design and its value in the marketplace. In the past half-dozen years, a number of new benchmark indices have arisen from the likes of DMI, McKinsey, and others that indicate the value of design to corporations and the financial premium that good design engenders on Wall Street.

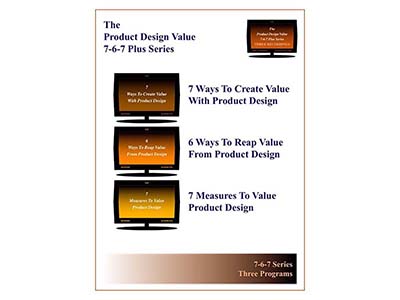
The Value of Product Design: This spring, GGI produced three one-hour programs that focus on The Third Coming, design techniques that generate disproportionate value, management techniques to reap the most value from design, and the metrics and benchmark indices that have risen to the top. These programs are not some flavor-of-the-day, they result from diligent research and industry observations on best design companies and industries. The material focuses on companies that design physical and internet products with user interfaces. GGI positioned the programs to be relevant now and several years into the future. Twenty topics are covered. There are 4-5 minute overview videos that take you through the table of contents for the Series and for each program.

The Product Design Value 7-6-7 Series

7 Ways To Create Value From Product Design

6 Ways To Reap Value From Product Design

7 Measures To Value Product Design
Measuring Product Development Productivity and R&D Performance: Consider joining us in London on November 5-6 for our two-day Masterclass sponsored by MOAS and Planisware. We’ll be taking a comprehensive look at measuring product development and its results, including a new mini-module that discusses our findings in 7 Measures To Value Product Design spanning both program and corporate management. There is a 4-minute overview video on the Masterclass landing page.

••••••••••••••••••••••••••••••••••••••••••••••••••••••••

Follow us on Twitter @GoldenseGroup

••••••••••••••••••••••••••••••••••••••••••••••••••••••••

Measuring Intellectual Property: Top 5 IP Metrics In Product Development

Due the technology boom in the late 1990s, which was coincidental with the rapid expansion of globalism and open innovation, and was then amplified by the less-than-stellar behaviors of certain countries, IP began to increase as a corporate priority.

As is the case when companies need to get their arms around new issues or opportunities, IP was first formed as “its own thing.”  There was an “IP Department.” Executives know that they must subsequently facilitate the integration a new requirement or capability into the right places in their organizations.  Leading companies began to do it around 2005.  For example, IP professionals were collocated in R&D and had dual reporting relationships – among many other techniques.

There was another issue though.  That issue remains today.  Valuing IP is a real bear.  Little by little industry is building experience as each transaction occurs.  However, it is still the wild west.  The value is what you are willing to pay for it.  Finance folks rule the roost.  Accounting folks are a long way from being able to assign standard values.  But, as experience builds, standard-like values will emerge as industry gains more and more examples for reference.  For certain types of commodity IP, standard ranges have already formed.

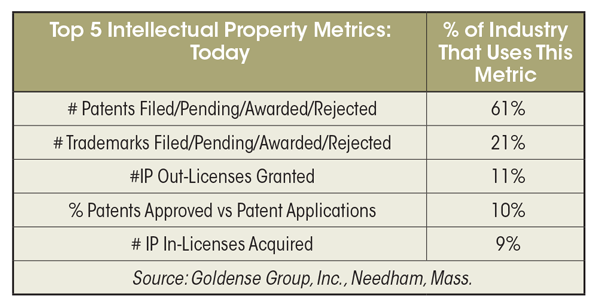
Well, as IP integration and uptake occurs, metrics follow.  Patents and Trademarks have long been metrics used by R&D and Product Development.  They are three of the top five still, and will likely remain.  But, two of the top five penetrating IP metrics have now been superseded by “licensing.”  “Number of Out-Licenses” and “Number of In-Licenses” have cracked the top five IP metrics now used across industries by the innovation functions.

Licensing is another form of codified IP, like patents.  Note that industry is still counting “its,” as it still does with patents (vs. “monetized revenues and/or profits”), but this is a clear sign of the progress of integration and awareness building.


Top 5 IP Metrics Used By Product Development CXOs

Measuring-Intellectual-Property-Top-5-IP-Metrics


Measuring Intellectual Property: Top 5 IP Metrics [Machine Design – October 2017] looks at the gradual inroads that IP metrics are making in the overall measurement of product development performance; and identifies the Top 5 IP Metrics used by R&D and Product Development.


••••••••••••••••••••••••••••••••••••••••••••••••••••••••

GGI on TWITTER

GGI Tweets content from primary and secondary research,

good articles in trade publications,

and announcements of GGI public events.

@GoldenseGroup


https://goldensegroupinc.com/blog/driving-product-development/wp-content/uploads/2017/10/Goldense-Measuring-Intellectual-Property-Top-5-IP-Metrics-A138.png

The Top 10 Product Development Metrics: Then & Now

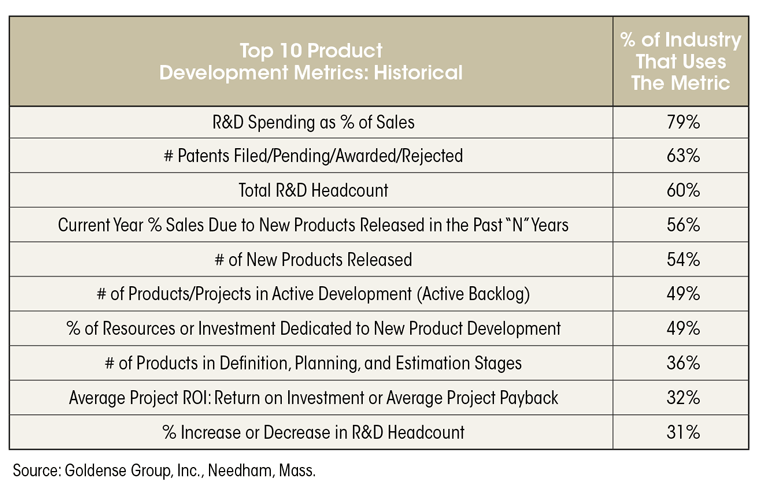
GGI started doing primary research on the penetration of specific metrics in R&D and Product Development in 1998. Now 2017, about 20 years time, we have taken the pulse six times.  Once every 3-4 years is a good cadence for R&D.  Process change takes more time in long duration business functions, such as the innovation functions, and then metrics follow.

There are always incremental changes in each research effort, and a few new metrics like the “Vitality Index” and “ROInnovation” that arise out of the blue, but the overall tenor remained the same.  CEOs accepted “activity metrics” from R&D.  This has been true since the start of my career.

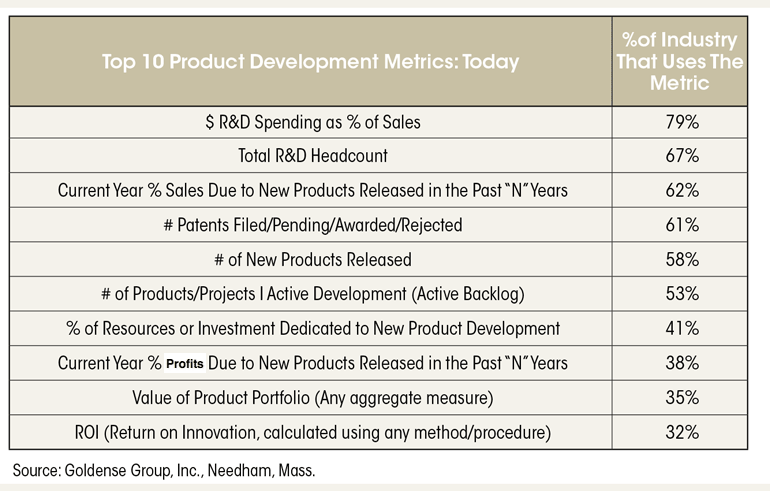
Well, evolving from the economic challenges of this past decade, CEOs now expect business performance metrics to a much greater extent.  Activity metrics still prevail among the top cross-industry metrics, but the tide has clearly shifted. New Product Revenues (aka Vitality Index) cracked the Top 10 in the early 2000s.  But, not a single measure of profit could be seen – until recently.

Business performance measures musn’t always be about revenue and profits, by any means.  The point is that there has been “a glaring absence of any prevalence of true performance measures.”

The additions, changes, and rearrangements in the Top 10 won’t knock your socks off.  But, given the decades of historical consistency, this is great progress in the advancement of management science for the creative functions.

We looked at 101 different corporate-level metrics.  Here are the Top 10.  You be the judge.


Top 10: Historical

Top-10-Product-Development-Metrics-Historical


Top 10: Today

Top-10-Product-Development-Metrics-Today


Top 10 Product Development Metrics: Then & Now [Machine Design – September 2017] identifies the top ten metrics, the degree of penetration across industries, and discusses the macro change that has taken place in the recent decade.


••••••••••••••••••••••••••••••••••••••••••••••••••••••••

GGI on TWITTER

GGI Tweets content from primary and secondary research,

good articles in trade publications,

and announcements of GGI public events.

@GoldenseGroup

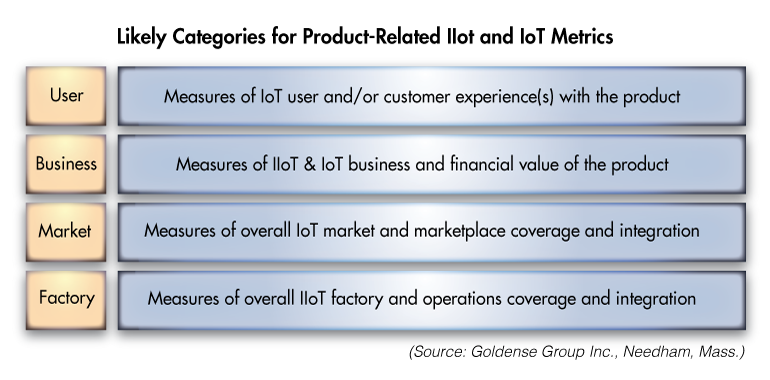
Metrics for IoT-Enabled Products

Metrics lag the introduction of new processes and new technologies by several years.  There are many reasons.  New business processes take years to evolve and become the new normal. Then, new measures get adopted. The infrastructure behind metrics is complex. People have to change what they track and record, then IT has to put it into a system. Management is uncomfortable with new metrics that do not have several years of past data. Few choose to recreate that data; rather they wait several years for it to accumulate and then they place the new metric into service. As well, R&D and product development are among the least understood major business functions. Business leaders hesitate to change measures in areas where they did not have direct experience on their way to the top of the corporate ladder.  Metrics for IoT-enabled products, processes, and technologies will be no different.


Risk Being Wrong

However, the IoT has been around for a few years now.  Some companies are in their third generation of IoT-enabled products and have some initial metrics in place.  Other companies are just warming up.  Given the almost unlimited scope of what the internet makes available, and thereby enables for all companies, picking one’s spots will be critical.

Discussions about appropriate metrics should probably begin sooner then they have historically begun.  Focusing on what to measure will spur the refinement of strategy and thinking on competitive positioning.


Get Organized

While there will be many new metrics, GGI estimates roughly fifty will be tried and will subsequently sort-out to a handful that will become widely adopted across industry, it will be best not to wait to see what others measure.  The playing field is nearly unlimited.  The generally adopted metrics may not yield the specific strategic advantages that most companies will seek.  Don’t sit back and wait to copy what others have done.

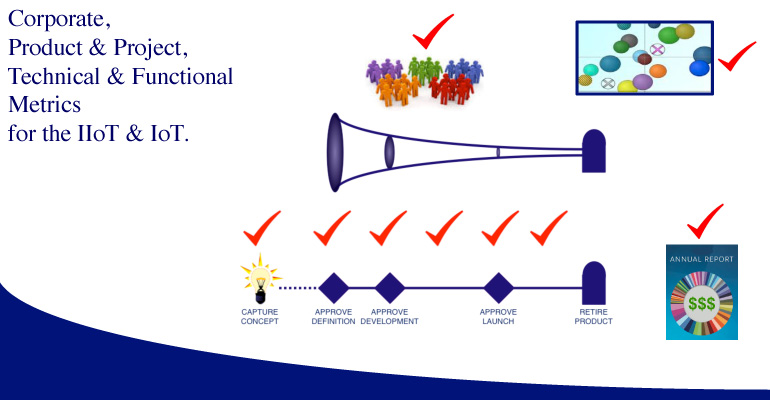
Over time, metrics will generally sort-out to four major categories:  Corporate Metrics, Project/Product Metrics, Functional/Technical Metrics, and Improvement Metrics.  A corporate brainstorming session might begin with these four areas for thought, and then seek input from participants using these general buckets to organize ideas.


Turn Over Rocks

At the next level of thinking, metrics for the IIoT and IoT will be different than many other corporate initiatives that have occurred over the years.  For example, take Open Innovation.  Whether a product originated organically or openly, the same measures capture customer experience.  This will not be the same for IIoT- and IoT-Enabled products. Data generated internally within a company’s IIoT may have some utility for customers.  Data acquired externally through the IoT, and/or a customer’s use of a product, may have some utility for the company that originally created the product – to enhance it, perhaps in real time.

These data may also be selectively packaged to create new “soft products,” that may or may not have anything to do with the value offering of the original product, that could produce incremental revenues and profits.  Few can see this far ahead.  It will take time for big data to accumulate to know for sure the assets one has, or has access to, but forge ahead with the thinking.

Thinking through these four areas will result in generating ideas that may then be subsequently refined to become Corporate Metrics, Project/Product Metrics, Functional/Technical Metrics, and Improvement Metrics.


Metrics for IoT-Enabled Products [Machine Design – July 2017] builds on these frameworks and suggests several specific metrics that may some day become generally adopted by industry – such as “Sensors Per Product.”


••••••••••••••••••••••••••••••••••••••••••••••••••••••••

MOON-ON-A-STICK

INNOVATION MASTERCLASS

Measuring Product Development Productivity & Performance

October 3-4, 2017

The Moller Centre

University of Cambridge

UK

BROCHURE


••••••••••••••••••••••••••••••••••••••••••••••••••••••••

GGI on TWITTER

GGI Tweets content from our primary and secondary research,

140-character summaries of good articles in trade publications,

and announcements and recaps of GGI events and presentations.

@GoldenseGroup

Please consider following GGI on Twitter.


https://goldensegroupinc.com/blog/driving-product-development/wp-content/uploads/2017/08/Metrics-for-IoT-Enabled-Products-Graphic-2.jpg