Measuring Intellectual Property: Top 5 IP Metrics In Product Development
Due the technology boom in the late 1990s, which was coincidental with the rapid expansion of globalism and open innovation, and was then amplified by the less-than-stellar behaviors of certain countries, IP began to increase as a corporate priority.
As is the case when companies need to get their arms around new issues or opportunities, IP was first formed as “its own thing.” There was an “IP Department.” Executives know that they must subsequently facilitate the integration a new requirement or capability into the right places in their organizations. Leading companies began to do it around 2005. For example, IP professionals were collocated in R&D and had dual reporting relationships – among many other techniques.
There was another issue though. That issue remains today. Valuing IP is a real bear. Little by little industry is building experience as each transaction occurs. However, it is still the wild west. The value is what you are willing to pay for it. Finance folks rule the roost. Accounting folks are a long way from being able to assign standard values. But, as experience builds, standard-like values will emerge as industry gains more and more examples for reference. For certain types of commodity IP, standard ranges have already formed.
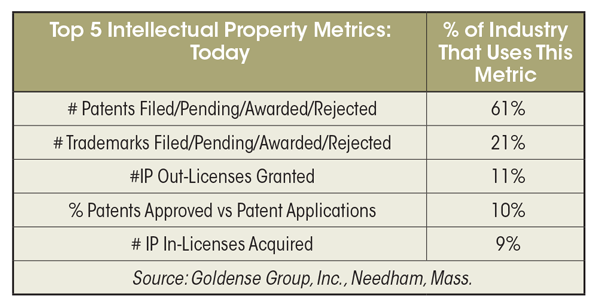
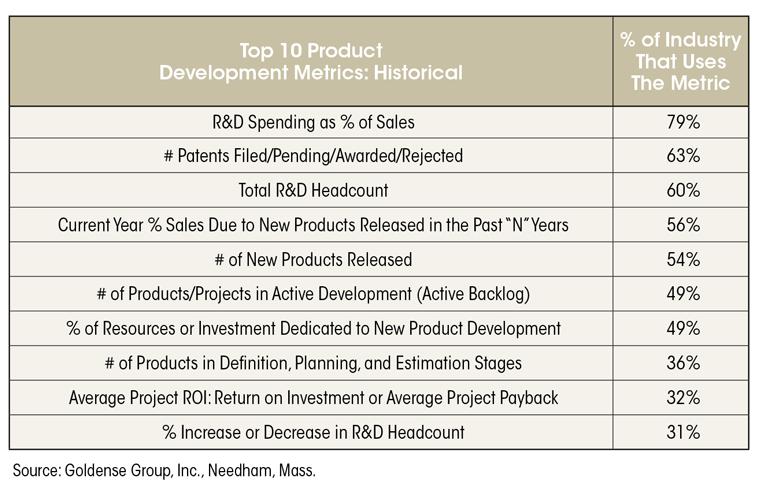
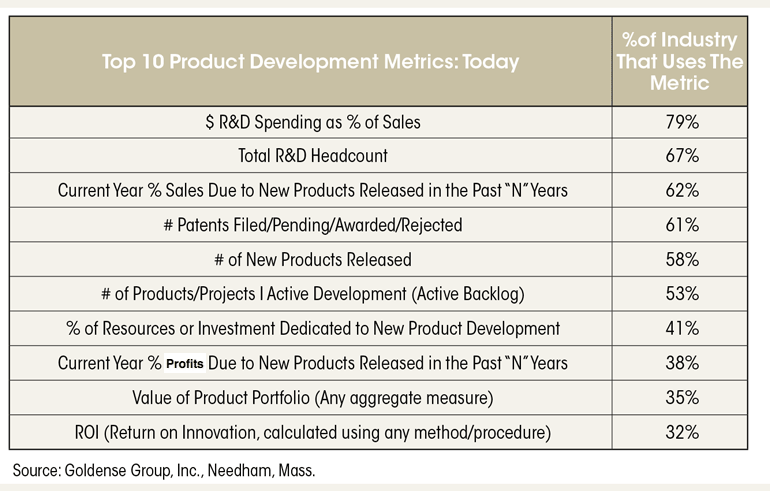
Well, as IP integration and uptake occurs, metrics follow. Patents and Trademarks have long been metrics used by R&D and Product Development. They are three of the top five still, and will likely remain. But, two of the top five penetrating IP metrics have now been superseded by “licensing.” “Number of Out-Licenses” and “Number of In-Licenses” have cracked the top five IP metrics now used across industries by the innovation functions.
Licensing is another form of codified IP, like patents. Note that industry is still counting “its,” as it still does with patents (vs. “monetized revenues and/or profits”), but this is a clear sign of the progress of integration and awareness building.
Top 5 IP Metrics Used By Product Development CXOs

Measuring Intellectual Property: Top 5 IP Metrics [Machine Design – October 2017] looks at the gradual inroads that IP metrics are making in the overall measurement of product development performance; and identifies the Top 5 IP Metrics used by R&D and Product Development.
••••••••••••••••••••••••••••••••••••••••••••••••••••••••
GGI on TWITTER
GGI Tweets content from primary and secondary research,
good articles in trade publications,
and announcements of GGI public events.
https://goldensegroupinc.com/blog/driving-product-development/wp-content/uploads/2017/10/Goldense-Measuring-Intellectual-Property-Top-5-IP-Metrics-A138.png
Measuring Intellectual Property: Top 5 IP Metrics In Product Development Read More »
![Goldense Group, Inc. [GGI] Logo](https://goldensegroupinc.com/blog/driving-product-development/wp-content/uploads/2022/03/logo-corp-darkBlue-65x65.png)

